Plotting fit results
Plotting
The saved results from a PAHFIT run can be plotted using the plot_pahfit
script. By default, the plot is displayed. To save the plot instead,
use the --savefig command line option.
$ plot_pahfit M101_Nucleus_irs.ipac M101_Nucleus_irs_output.ascii.ecsv
The first argument gives the file with the observed spectrum.
The second argument gives the file with the output of the run_pahfit
script, or a model that was saved using Model.save().
Help for the possible command line options for the plot_pahfit script
can be seen by:
$ plot_pahfit --help
For making custom plots, the model can be loaded in python using Model.from_saved(). The
default plot is made using Model.plot(). Several methods that return a certain model
components, to be used for plotting and analysis, will be implemented in the future.
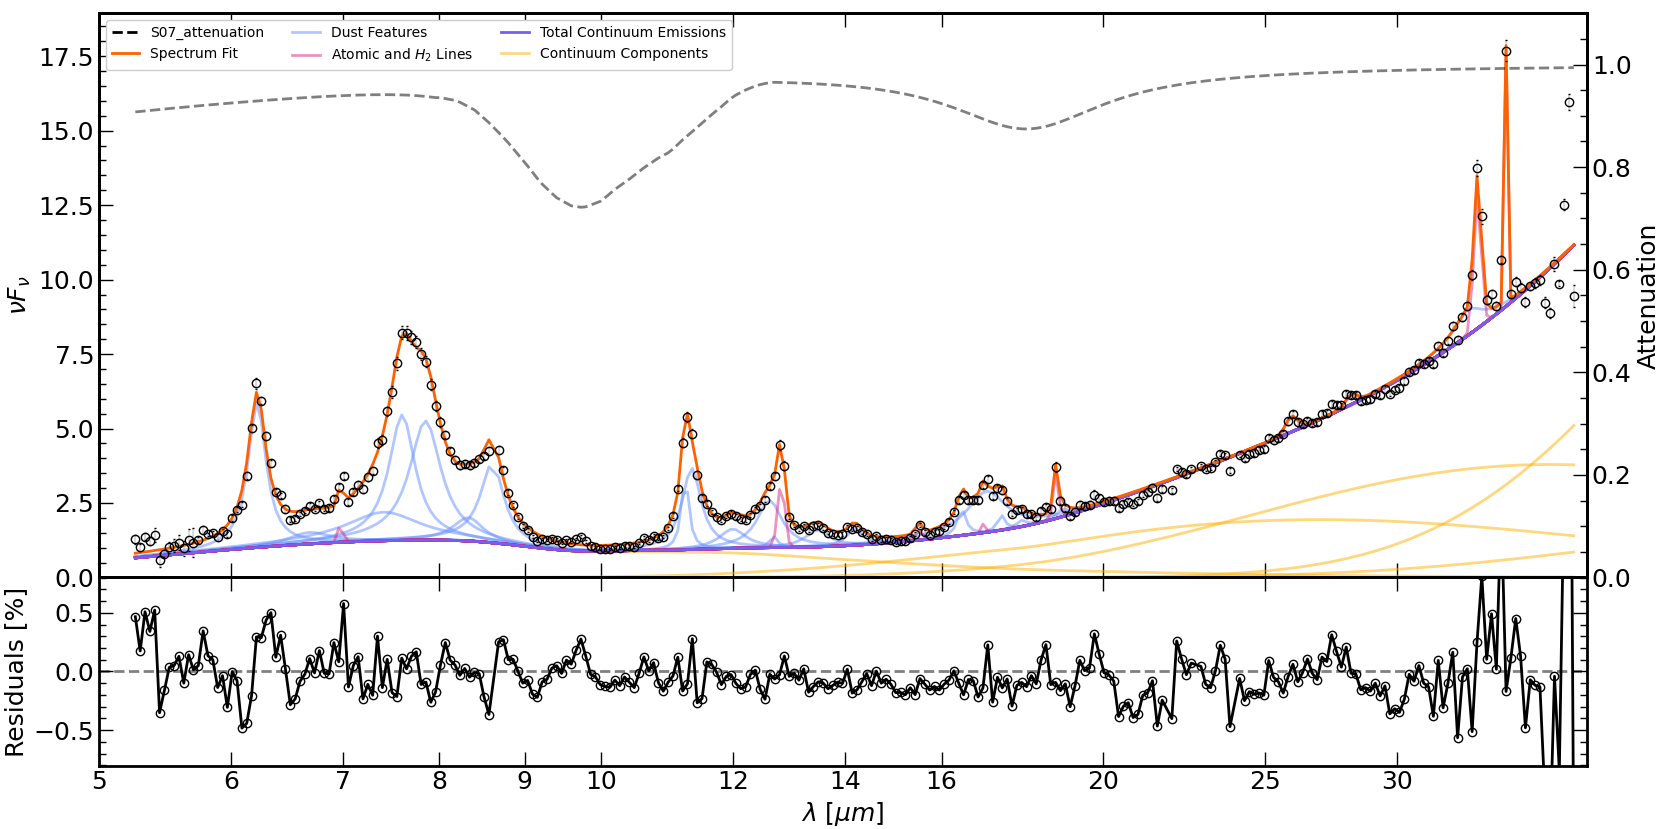
Example Plot
The default output figure is shown below. The top panel displays the observed spectrum as open circles; the full PAHFIT model, the dust and stellar continua, and the sum of the continua as solid lines (see the legend for the color coding); the dust features as blue lines; and the atomic features as purple lines. The attenuation is shown as a dashed line at the top. The bottom panel displays the residuals.