PAHFIT v2.1 (2.5–38 µm)
Summary of the additional features including in PAHFIT v2.1
Details can be found in Lai et al. 2020, ApJ, 905, 55.
Dust features:
Name |
Wavelength (µm) |
|---|---|
PAH 3.3 |
3.29 |
Aliphatic |
3.40 |
plateau |
3.47 |
PAH 5.24 |
5.24 |
PAH 5.33 |
5.33 |
Line features:
Name |
Wavelength (µm) |
|---|---|
Br beta |
2.63 |
Pf gamma |
3.74 |
Br alpha |
4.05 |
Pf beta |
4.65 |
Absorption features:
Name |
Wavelength (µm) |
|---|---|
H2O |
3.05 |
CO2 |
4.27 |
CO |
4.67 |
H2O |
6.02 |
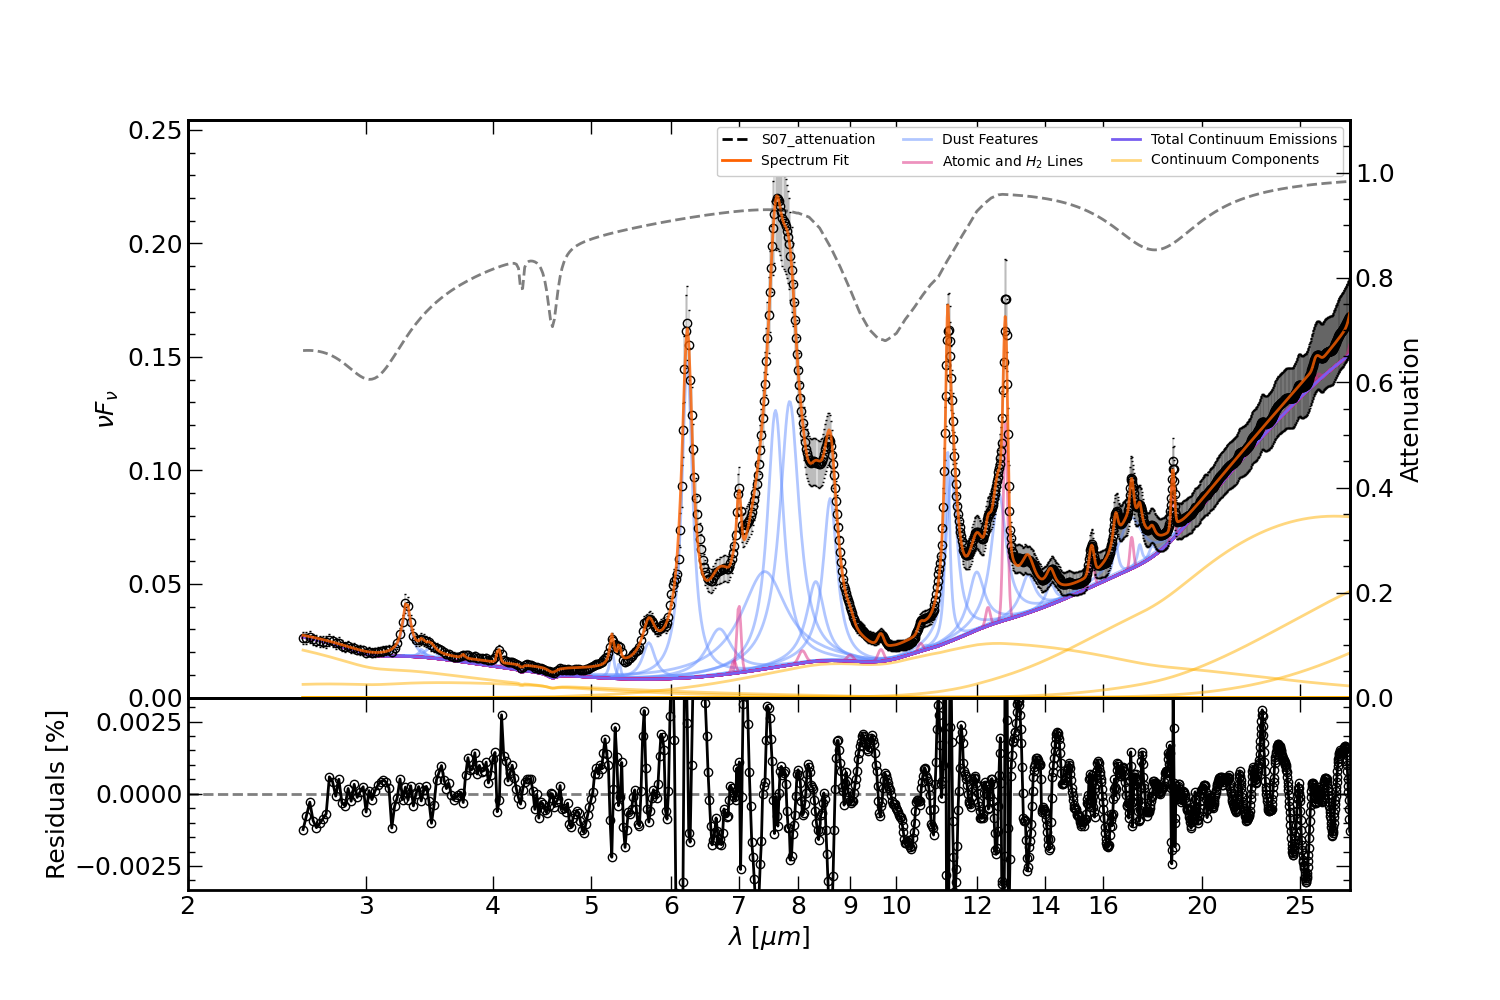
Fitting and plotting the AKARI+Spitzer spectrum
The example here is based on the 1C spectrum, produced by averaging spectra of 60 PAH bright galaxies, in Lai et al. 2020, ApJ, 905, 55.
To run the fit and output the plot, simply type:
$ run_pahfit Lai2020_1C_akari_spitzer.ecsv scipack_ExGal_AkariIRC+SpitzerIRSSLLL.ipac
$ plot_pahfit Lai2020_1C_akari_spitzer.ecsv Lai2020_1C_akari_spitzer_output.ipac
Below shows the image output. The description of the output plot is similar to that in the Example Plot, but with an additional spectral coverage down to 2.5 micron.